A diagram can be used to improve the layout of the overall report. To this end, a diagram is to be created which reflects the available memory space on each drive of each client in relation to each other. Create the diagram with the Insert diagram tool and place it in the footer of the Detail tab. A dialog appears for configuring the diagram.
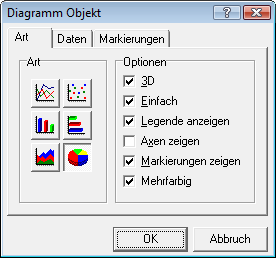
The dialog offers the three tabs Type, Data and Markings. In the tab Type, the type of diagram as well as some display options can be entered. The data space serves to enter report elements that contain the data which are to be displayed. In the last step, you can define in the section Markings how the data of the diagram are to be labelled.
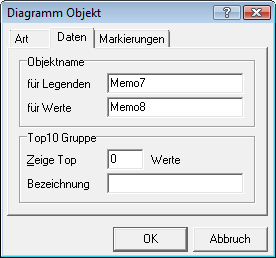
Select the pie chart in the Type tab. This makes it possible to present the data in relation to each other. The options do not have to be changed. Now enter the report elements containing the relevant data in the Data tab. Use the name of each drive as legend. Enter the internal name of the rectangle object with the label [vLogical Drives-> Drive Label]. In this case, the name is Memo7. For the statement of the values the same principle apply. Enter the internal name of the element with the inscription [vLogical Drives-> Drive Free Space]. This element includes an indication of the free memory space on a drive, and the name is Memo8. The other information does not need to be adjusted. The following screenshots show the settings in the dialog:
|
|
To find out the internal name of an element, select it and launch the Object Inspector. This shows, among other things, the name of the element. The name is displayed in the upper drop-down list.
Note that in diagrams, only data that are directly interrelated may be used for legends and values. If, in this example, the computer name (Memo3) is entered as legend, it would not be possible to create the diagram, because the data (available memory space) relate directly to each drive, but only indirectly to the client (computer name).
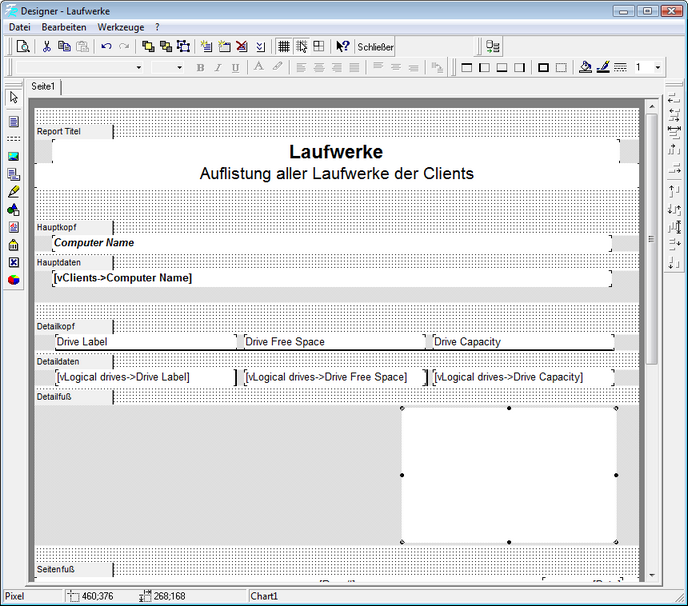
To display the diagram properly, enlarge the diagram element by means of the frame points. This means that the footer of the detail tab must be enlarged in height as well. In addition, other adjustments must be made to improve the layout of the report:
| ▪ | The report title must be enlarged in height to keep a certain distance from the top of the page. |
| ▪ | A side margin is inserted, which is also enlarged slightly in height. This ensures that a certain distance is maintained between the report title and the first list. Likewise, a distance is created to the top margin on the following pages. |
| ▪ | The rectangle object in the main header is formatted in bold and italics. |
| ▪ | The Maing data space is expanded downward to maintain a distance to the actual data. The rectangle objected contained therein is formatted in bold. |
| ▪ | The Detail header must be enlarged somewhat in a downward direction to permit the drawing of a horizontal line. This is done with the Insert line tool. |
| ▪ | Vertical lines are drawn to between the rectangle objects of the Detail space to create a visual separation of the individual data sets. |
| ▪ | The page footer must be enlarged somewhat in a downward direction to maintain a distance between the bottom margin of the page. |
The following screenshots shows the layout of the report after these adjustments:

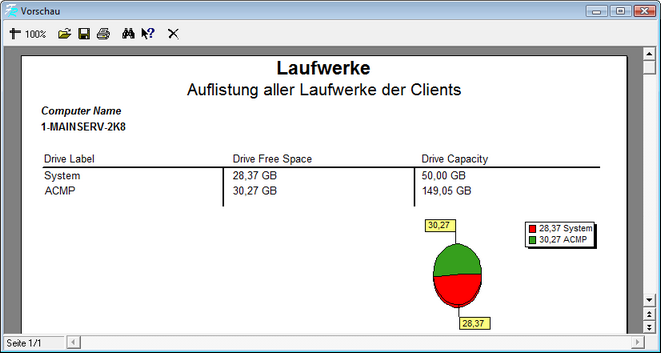
The report might look then as follows:

Last change on 10.03.2014

