After the query has been executed, the results appear in a new vertical tab with the name of the query. The results are displayed in so-called grid. The grid reflects the data in a table according to the sequence of the fields selected at the time of the generation of the query. In the case of data sets that contain a field with multiple values (e.g. several IP and MAC addresses of a computer), these multiple values are displayed in a sub-table. These sub-table can be opened or closed with the ![]() /
/![]() button in front of a data set with multiple values.
button in front of a data set with multiple values.
An icon in front of each data set indicates how the related client was inventoried:
|
The client was inventoried via the ACMP Agent . |
|
The client was inventoried via the OneScanClient . |
|
The client was inventoried via the Agentless Scanner . |
|
The client was registered manually . |
|
The client was inventoried via the XML importer (Linux). |
|
The client was inventoried via the XML Importer (Mac). |
|
This is a mobile client with android |
|
This is a mobile client with iOS |
Filter Query Results
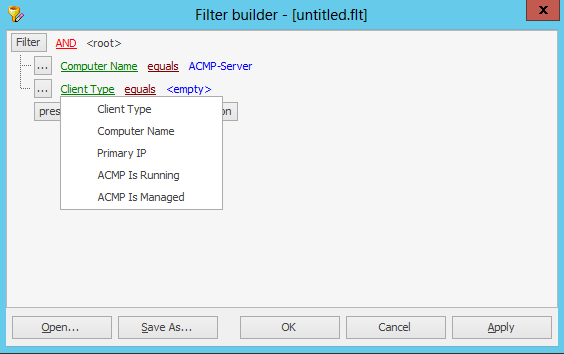
To improve the results or to present them more transparently, there are several possibilities. You can now filter the results again. This is done via the Filter query results icon in the speed dial bar. The Filter editor then opens. First enter a new requirement here. A requirement consists of three parts: column name, comparison operator and a comparison value. First select a column according to which you want to filter. All the columns contained in the query are at your disposal.

Filter Editor
You can then select a comparison operator and a corresponding value. By clicking on Apply, you can apply the filter thus created to the query result. It is also possible to save the filter for later use.
Export query results
Of course you can also export your query results to be able to use them elsewhere. You can achieve this also by clicking on the Export query results icon in the quick access toolbar. In the first step of the wizard that unfolds you have to select the data sets that have to be exported. You have three options:
| • | Export all lines |
| • | Export selected (highlighted) lines |
| • | Export not selected (highlighted) lines |
Select the appropriate option and click on Next to move to the second step. Here you have to select the export format. You can choose between CSV (Comma Separated Values) and XML.
When you select XML, no further information has to be provided. However, if you select CSV, you can select the delimiter (comma, semicolon, pipe, tab stop) and decide if the column names are to be exported as well.
Click on Finish and then enter the memory location and the file name in the dialog box.
Change query and refine query results
To change a query or to refine the results, run the appropriate query. In the grid of the result itself, the data can now be sorted by moving the columns by means of drag&drop. Via a drop down menu of the columns, further filters can be activated, e.g. according to a certain value.
Furthermore, it is possible to move the columns into a sorting box. Thus, the results are grouped according to the values. It is to be also possible to group by multiple columns. With a small arrow, this group can be sorted in ascending or descending order.
The horizontal tabs represent further opportunities to influence the query results. Here you can change the settings that you have made when creating the query (see Creating a Query). Thus there are the following tabs:
| • | Results |
| • | Fields |
| • | Filter |
| • | Safety |
| • | Properties |
Show details
There is the option to look at the data of a client in more detail. This can be done with a double click on a client in a query result. Alternatively you can select one or more client computers in your query results, and click on the Display client details icon. This will open one or more additional vertical tabs with the names of the selected clients. All categories of query values will be displayed in a tree structure. If you click on one of these categories, a detailed list of the fields in this categories with their values appears on the right side.
Last change on 13.04.2017