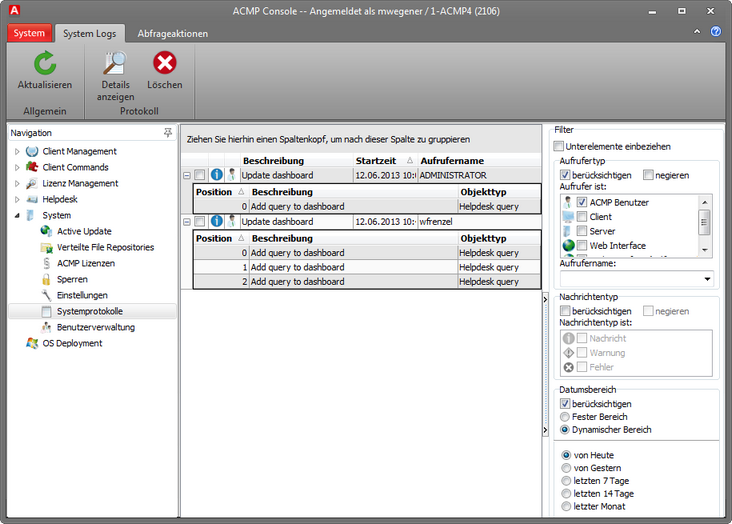
Here you will find a chronological list of all activities of the ACMP. The individual datasets are referred to as logs.

System logs
Since the ACMP creates logs of all actions, the number is constantly growing. A wide range of functions of a filter system are available to keep track of the logs. The relevant settings are listed on the right side of the console.
Filter
With these filtering options you can ensure, by enabling the top checkbox, that the following options are also applied to the log details. Each filtering option must be enabled by checkmarking the Include box. Likewise, all filtering options (exception: date range) can also be negated.
In the filtering options, you can select, among other things, the Caller type. Here you can specify if the log has been created by an ACMP user, a client or the server. If you select the ACMP user or the client at this stage, you will find in the drop-down box below all known clients as well as the created user. Here you can select a particular one, but are not required to do so. In the case of a selected server, you will not be able to make a selection, as only one server is available.
In the message type section, you can choose whether simple messages, warnings or errors should be filtered or not. Messages in this case mean simple messages that describe an action or a status, and only serve to log this action or status. Warnings relate to are minor problems detected by the system, while errors refer to major problems.
In the date range you can filter logs (or exclude logs from the filter) according to a period of time. For this purpose, you can selecte either a Fixed data range or a Dynamic data range. While you specify in the Dynamic data range, that logs of Today, Yesterday or Last x days are to be filtered, you must define a start and end date for the Fixed data range. You can enter this information with an expandable calendar.
Category is the last option. Here you can select one or more categories, according to which you can have the results filtered. Since the categories have self-explanatory names, it should not be too difficult to make the proper selection.
Now click the Apply filter button to have the logs filtered. To restore the original view, click the Reset button, and then again the Apply filter button.
Log details
You have two options to review the logs in more detail. Double-click any log, or checkmark one or more logs, and then click the Show log details icon in the quick access toolbar.
In both cases, an expand icon (+) appears before the selected logs, which you can then view in a subform which displays additional information.
Clear logs
If you select one or more logs with a checkmark, yyou can delete the selected logs with the Delete logs icon.
Last change on 10.03.2014